Farmer Thrams ... and "The $87.5 Million Income Mistake"
Seven income stocks ... AND valuable lessons from a thrifty saver — from 136 years ago ...
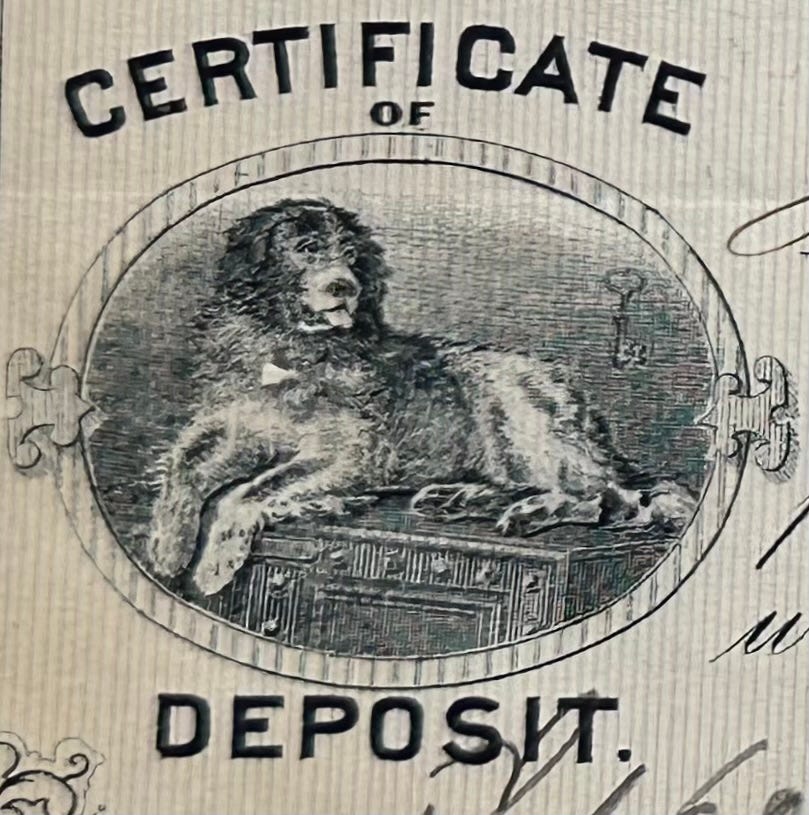
In August 1888, a man named Henry A. Thrams walked into Iowa’s Osage National Bank and put $60 into a four-month “certificate of deposit” — with a 3% yield.
I actually have the CD — it’s part of my hefty collection of financial ephemerae — and when I hold it and look at the dates, I feel like I’m jumping back in time.
I’m a history nut at heart — it’s part of why I spent 22 years as a reporter — and I started thinking about what life in rural America must’ve been like 136 years ago. I even started down a bit of a research “rabbit hole” — but was lucky enough to find some of the Henry Thrams “backstory” pretty quickly.
In fact, thanks to an obituary and portrait of the man I found, I can actually share a nice little biographical “snapshot” of the man — a thinnish gent with piercing eyes, an aquiline nose, a shock of hair and an impressively bushy “gunslinger” moustache.
Thrams was born in Germany. His folks brought him to America when he was five. He was a farmer. At the time of this banking transaction, he was 36 and had been married for eight years. He and his wife Minnie had six kids. And he kept the Sabbath and was viewed as a “pillar of strength” in the community.
Like us, Thrams was a saver — and understood the importance of income … maybe even more than folks do today.
That $60 back in 1888 is the equivalent of $1,988 in today’s money. But back then, household income was running between $600 and $700 a year – with an average of $50 to $100 of this contributed by other family members (usually kids), says a 2016 research paper by Clemson University and the National Bureau of Economic Research (NBER).
So that $60 represented about 10% of the average household income of the day — at the upper end of a 4% to 10% savings rate of the time, the Clemson/NBER research found.
Here in America, the personal savings rate is about 2.9% right now, down from 4.4% last year and less than half the long-term average of 8.44%.
So (at least from what we see here) Henry Thrams was a better “saver” back then than most Americans are today.
Granted, farmers and other “regular” Americans in the late 1880s didn’t have access to the wide array of savings, income and investment “products” that we can choose from now. They did “invest” in their homes: Investments in residential structures represented about 8% of gross domestic product in the 1880s, the Clemson/NBER paper said. Today it’s only about 3% to 5% of GDP, says the National Association of Home Builders (NAHB), the top trade group for American home-construction companies.
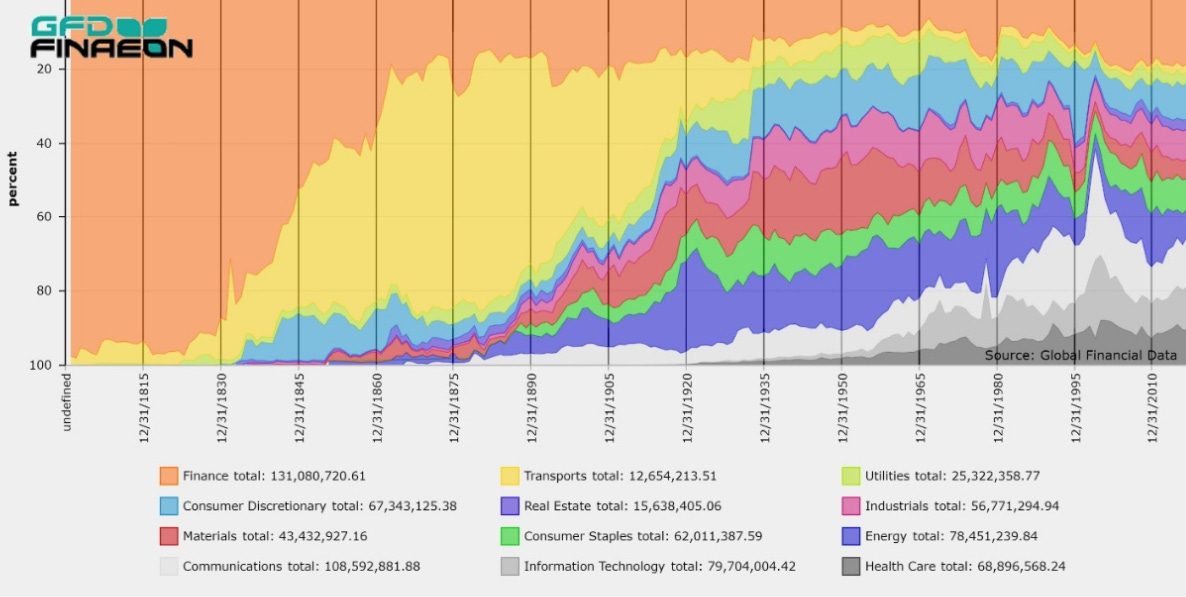
To be clear, there were stocks to buy. And in the late 1880s — right about the time that the hero of our story bought his CD — the stock market was changing. To that point, financials and real estate were the dominant plays. But they started giving ground to transports (railroads), materials (mining), industrials (manufacturing), consumer staples and communications companies.
And like the former reporter, history buff, analyst, stock picker and audience educator that I am, this ignited a need to “find out more” — a past-and-present comparison that sent me down one of those “research rabbit holes.”
And that research helped me uncover “The $87.5 Million Income Mistake” — which I’ll show you … and then show you how to avoid.
But I need to lay some groundwork — starting with the “income basics” — which most investors just don’t get.
FATAL INCOME MISTAKES
Most people look at “income” the wrong way. Or, at least, in an incomplete way.
When shopping for money markets, CDs or bonds, folks look at the “nominal” yield — the “coupon” or stated rate.
They don’t look at the “real” return — what they get after the inflation rate is backed out.
They definitely don’t look at the “cash flow” — how much ends up in their pocket (or brokerage account) after inflation, taxes, fees or other “afterthought” costs are backed out.
And they’re often prone to one of two mistakes, either:
Over-Reaching for Yield: Going outside real income products and succumbing to “pretenders” – including, hugely risky options products that marketers label as “income-generators.” Don’t get suckered by the outsized risk: The odds of a major loss are swamped by any “alpha” income you might grab. But the more common issue is …
Not Shopping Around: Farmer Thrams didn’t have this luxury; other than shopping from bank to bank – which back then meant physically traveling from one to another – there weren’t as many “income” options back then. Investors have no such excuse today.
It’s the second mistake we’re going to focus on here today.
Shopping around is crucial for your long-term results.
But the short-term stakes have just increased. As I detailed here, the U.S. Federal Reserve this week cut the benchmark Fed Funds rate by half a percentage point. That’ll work its way through the financial system, bringing down interest rates on money-market funds, passbook accounts and CDs.
That’s more important than usual right now because of the $12.5 trillion “Reinvestment Tsunami” whose first waves hit in just weeks. High-yielding CDs and government debt start coming due in October, which means hordes of investors will be forced to find new places to put their money … just as the interest rates on the investments are falling even more.
Account for all those factors, and consider them from a cash flow perspective: In short, you need to ask:
How much is actually going into your pocket?
How much is that cash worth in “real” (adjusted) terms?
And does the yield you’re getting put you ahead of the prevailing rate — but not so far ahead that you’re up in stratospheric-risk territory?
The upshot: Income-seekers will need to use more diligence than usual to find good income plays —without overreaching.
Squeezing yield — without stumbling into landmines like risky options masquerading as “income” investments — is crucial.
And I’m going to use Farmer Thrams, the 136 years that have elapsed since he walked into Osage National Bank (and an extreme example) to prove it.
I’M ABOUT TO STUN YOU
Before we get started, let me make this statement right up front: To run this little “thought experiment” — to keep it simple and to really drive home our point — I made several assumptions.
Let’s say you have that same $60 as Farmer Thrams. And you planned to invest it for 136 years.
You’ve got two options:
That Osage National Bank CD yielding 3%.
And another income play yielding 11% (which is the 10-year return of the S&P 500).
I ran both through several investment calculators — one with the help of a former professional investment advisor to check my work.
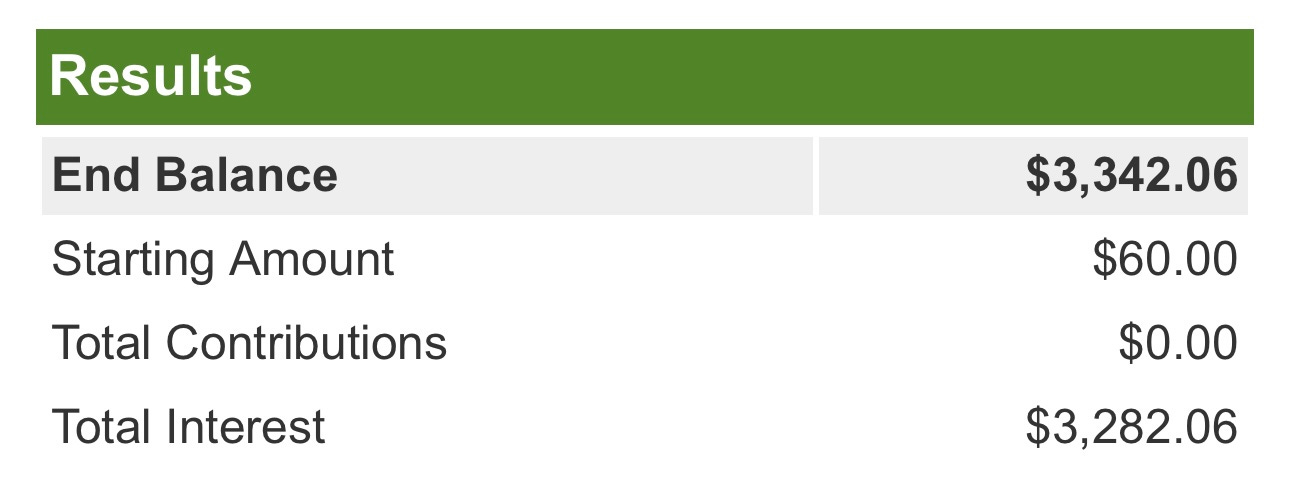
In 136 years, the CD will grow to $3,342 — before adjusting for inflation, taxes and the other aforementioned cash-flow reducers.
In 136 years, the 11% investment will grow to a bit more than $87.5 million.
That’s not a typo … I’m talking “million” — with an “m.”
Again, that’s unadjusted for taxes, inflation et al.
But it’s correct.
That’s “The $87.5 Million Income Mistake” that I promised to share … and now I have.
As stated, I ran it through several investment calculators. I grant you: The resulting numbers varied. The exercise I ran with my friend got me to $3,342 and $90.1 million, respectively. One I ran through an AI query got me to $721.80 and $65.4 million.
The variance is easy to explain. There are differences in each of the equations — differences that probably aren’t that big, but are magnified by the hefty time frame. It’s kind of like an airplane making a long-distance flight of thousands of miles: If the navigator is off by half a degree at the start, the airplane can miss its destination by hundreds of miles — and perhaps even go lost. (If you want an example, go back and study Amelia Earhart’s 1937 final flight).
Besides, it’s magnitude — not the specifics — that you need to focus on here.
I’ve just showed you folks the importance of finding “real” income.
Let’s take the next step.
INCOME-SPIGOT PLAYS
I’ve done the homework. Now it’s time for the payoff. Here are seven income investments you can add to your research list.
And here’s why I like them.
Income Play No. 1: Angel Oak Financial Strategies Income Term Trust FINS 0.00%↑, a Big Board-listed closed-end fund that invests primarily in financial-sector debt — including structured debt and mortgage-backed securities. It aims to keep at least 50% of its holdings invested in investment-grade debt. And it also buys financial-sector stocks — both common and preferred. FINS currently trades at about $13.10 — putting it up near the top of its 52-week range of $11.66 to $13.24. Its current payout of $1.31 a share — doled out as monthly 11-cent dividends — equates to a yield of 10.57%.
Income Play No. 2: The Carlyle Credit Income Fund CCIF 0.00%↑, a closed-end fund that invests in “collateralized loan obligations,” or CLOs. Once a “niche” market, CLOs have exploded into a $1.2 trillion financing venue that fills about 70% of the demand for U.S. corporate loans. Carlyle is an interesting income play because — in July — it changed its name from the Vertical Capital Income Fund to CCIF. The reason: Carlyle Global Credit Investment Management LLC took over as the fund’s advisor. CCIF invests in both debt and equity “tranches” of CLOs. The shares were recently trading at about $8.50 — near the top of the 52-week range of $7.43 to $8.80. The net asset value (NAV) per share at the year’s midpoint was $7.68. At CCIF’s current trading price, the $1.19 yearly payout translates to a yield of 15.41%. Dividends are paid monthly.
Income Play No. 3: AGNC Investment Corp. AGNC 0.00%↑, a real estate investment trust (REIT) that invests in residential mortgage securities. It’s based in Bethesda, Md., a little under two hours from my home office. At a recent price of $10.64, the $1.44 in yearly dividends translates into a yield of 13.66%. Dividends are paid monthly. And as I detailed in a recent report, the company has been aggressive with buybacks in the past. There’s an existing buyback program that’s still to be finished.
Income Play No. 4: New Mountain Finance Corp. NMFC 0.00%↑, a business-development company (BDC) that specializes in private-equity investments, lending and buyouts involving middle-market companies in energy, chemical, materials, engineering, tech and distribution companies. As rates fall, dealmaking volume will climb. And private-equity deal-making, in particular, is surging — as we’ve been reporting. At a recent price of $12 a share, the $1.36 annual dividend gives investors a yield of 11.3%.
Income Play No. 5: Ellington Financial Inc. EFC 0.00%↑, another REIT that specializes in residential mortgage-backed securities (RMBS). At a recent price of $13.15 a share, the $1.56-a-share dividend works out to a yield of 11.77%. Like some of the other income plays on your list, dividends are paid monthly.
Income Play No. 6: OFS Credit Co. Inc. OCCI 0.00%↑, a closed-end management investment company that invests in debt-and-equity collateralized loan obligations (CLOs). Consider this high risk. But at a recent trading price of $7.65, the $1.38 dividend translates to a yield of 18.05%.
Income Play No. 7: Oxford Lane Capital Corp. OXLC 0.00%↑ , a publicly-traded closed-end management investment company that invests in debt-and-equity tranches of CLOs. At a recent price of $5.20, the $1.08-a-share dividend translates to a yield of 20.77%.
There you have it: A “baker’s half-dozen” (meaning seven, and not six) list of investments aimed at helping you avoid “The $87.5 Million Income Mistake.”And as a reminder for SPC Premium members, we have two more income plays (with an accompanying Dossier) in our Model Portfolio.


Nice one! I liked the story and setup and good advice as well!